Project Snapshot
Role: Lead Product Designer
Duration: 3 Months
Team: Product Design, Product Management, Engineering
Platform: Adlumin Security Operations Platform
Impact
Reduced vulnerability remediation time by 80% through improved prioritization and remediation workflows
Supported analysis of 150K+ vulnerabilities across enterprise environments
Transformed vulnerability visibility from monthly third-party reporting to near real-time monitoring
Led the redesign of Adlumin's Continuous Vulnerability Management platform
Consolidated vulnerability discovery, prioritization, patch management, and remediation tracking into a unified workflow
Established reusable dashboard, data visualization, and enterprise table patterns adopted across the platform
Improved operational visibility through executive dashboards, remediation tracking, and risk prioritization workflows
Leveraged a shared design system to accelerate development and maintain consistency across security operations experience
Continuous Vulnerability Management
Overview
Continuous Vulnerability Management (CVM) is a cybersecurity platform designed to help SOC analysts identify, prioritize, and remediate vulnerabilities across assets in near real-time.
When I worked on CVM, the experience was constrained by fragmented data, third-party limitations, and inconsistent workflows across vulnerabilities, assets, and patching systems. Analysts struggled to quickly understand risk, act on insights, and scale their workflows.
I was tasked with redesigning CVM into a cohesive, data-driven application that unified workflows, improved clarity, and supported scalable decision-making across the platform.
Problem
Before: Legacy Dashboard Experience: The original dashboard presented multiple competing data visualizations without clear hierarchy, making it difficult for users to quickly assess vulnerability trends or prioritize action.
Fragmented Experience
Disconnected workflows across Vulnerabilities, Assets, Patches, and Reports
Lack of consistency in navigation, filtering, and interaction patterns
Data Limitations & Complexity
Third-party integrations (Qualys) limited available data and created gaps
API rate limits introduced latency and scalability issues
Users lacked visibility into real-time or near-real-time security posture
Poor Signal-to-Noise Ratio
Analysts struggled to prioritize critical vulnerabilities
Overwhelming tables without meaningful hierarchy or context
Inefficient Workflows
Difficult to move from insight → investigation → action
Filtering and sorting lacked flexibility and clarity
UX Research
To validate usability and identify workflow gaps, I conducted a targeted UX survey with SOC analysts using the CVM platform. The goal was to better understand how users prioritize vulnerabilities, interact with data, and where friction exists in real-world workflows.
Key Findings
Strong usability foundation
All users rated the platform as easy to use, confirming that the core experience was intuitive and accessible.Data trust was the biggest issue
Users reported that delayed updates and inaccurate reporting limited their ability to respond to threats effectively.Critical vulnerabilities drive behavior
Critical and active vulnerabilities were the most relied-on KPIs for decision-making.Installed patches lacked value
This KPI was consistently seen as the least useful, signaling a gap in actionable insight.Need for centralized, actionable views
Users wanted a single place to track:Actionable vulnerabilities
Non-patchable items
End-of-life systems
Newly discovered and resolved issues
Visualization supports faster decision-making
Trend-based graphs (active severities, historical vulnerabilities) were the most effective in helping users assess risk.Feature discoverability gaps
A portion of users were unaware of filtering capabilities, indicating usability gaps in advanced workflows.
Approach
The redesign was directly informed by UX research insights, ensuring solutions addressed real user needs around data trust, prioritization, and workflow efficiency.
I led the redesign of CVM by focusing on unifying workflows, clarifying complex data, and improving usability at scale.
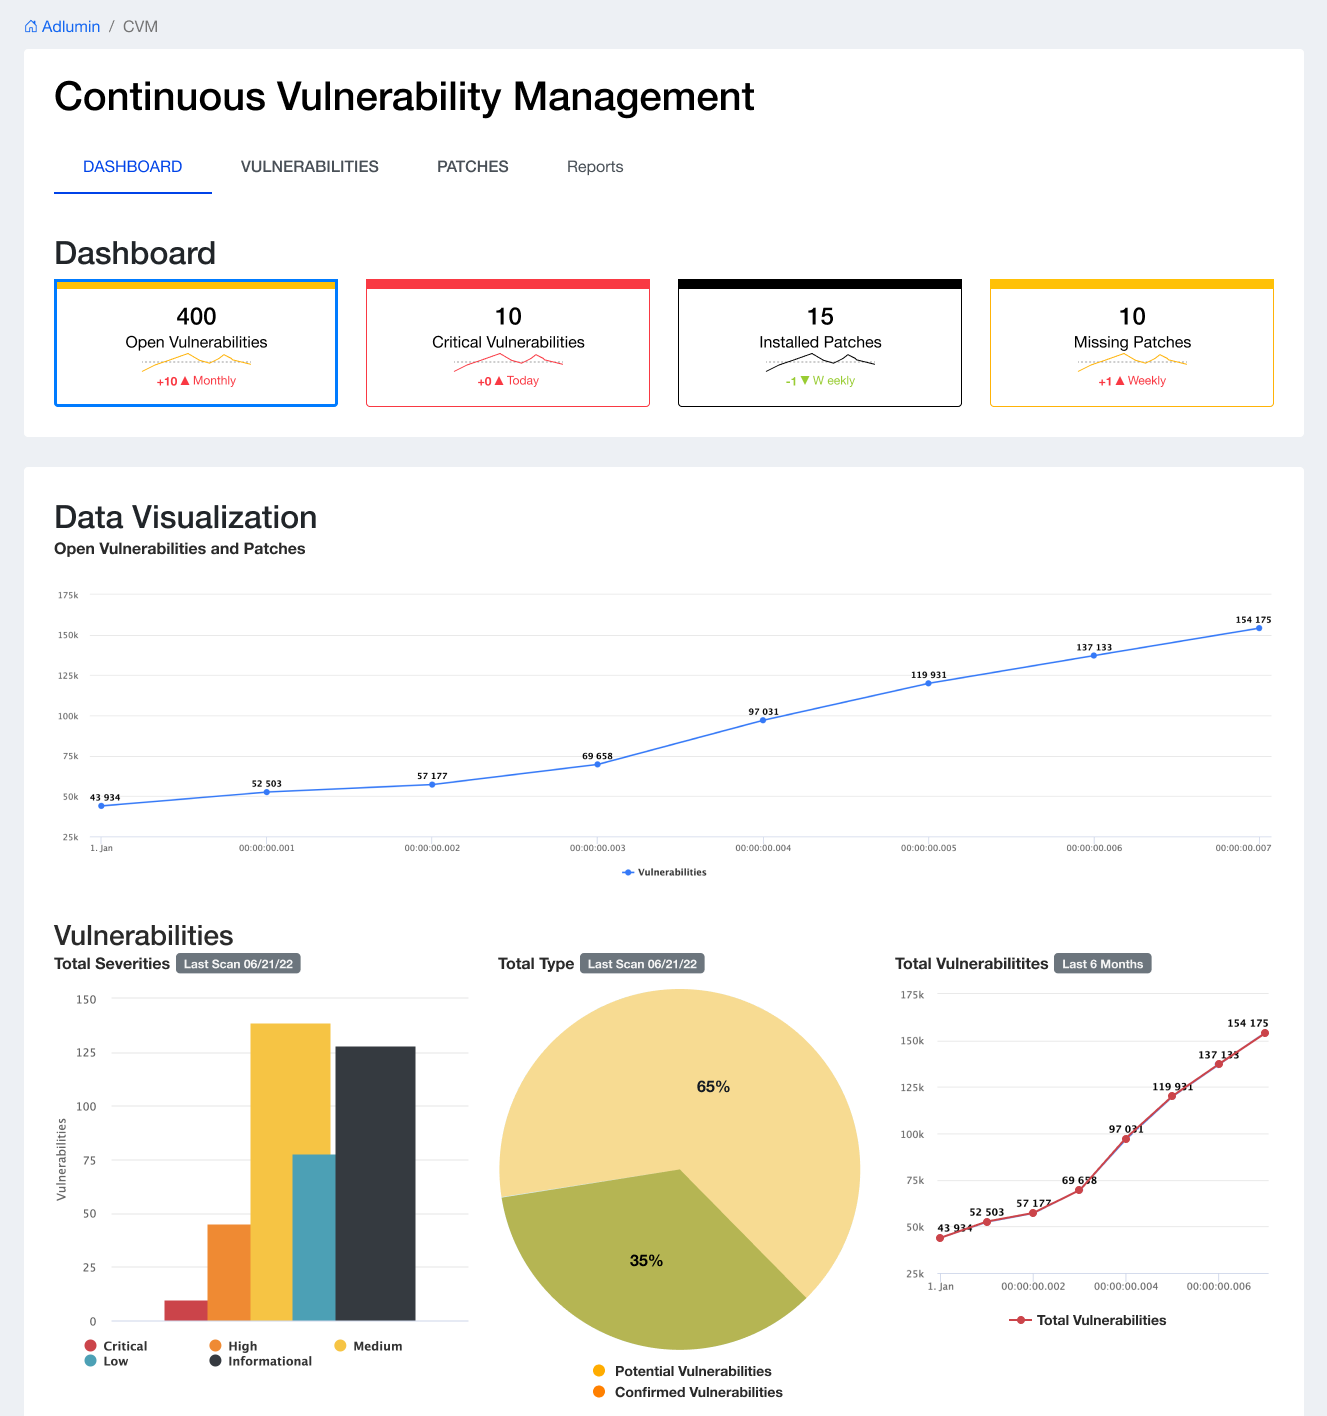
After: Structured Vulnerability Dashboard: The redesigned dashboard introduces clear data hierarchy, consistent interaction patterns, and prioritized visual signals, enabling analysts to quickly assess risk, identify critical issues, and take action with confidence.
1. Unified Information Architecture
Structured CVM into 5 core areas:
Insights
Vulnerabilities
Patches
Assets
Reports
Created consistent navigation and mental models across all views
2. KPI-Driven Decision Layer
Introduced top-level KPI cards across all tabs:
Total vulnerabilities
Active vs. fixed
Patch status
Asset coverage
Enabled at-a-glance risk assessment
3. Data Visualization for Pattern Recognition
Designed trend charts for:
Vulnerabilities (Active vs. Fixed)
Patches (Installed vs. Missing)
Assets (Coverage over time)
Helped analysts quickly identify risk trends and remediation progress
4. Scalable Data Tables & Filtering System
Built a flexible filtering system:
Severity
Status (Active, Fixed, Missing, etc.)
Date ranges
Asset attributes
Standardized table interactions across all modules, including sorting, filtering, and row expansion—ensuring a consistent experience across complex workflows.
Designed to support 10,000+ records while maintaining performance, clarity, and usability.
Designed for 10,000+ records with flexible filtering and consistent interaction patterns across workflows.
From Insight to Action
I extended the experience beyond analysis by enabling clear, actionable workflows across patch management
Enabled analysts to move from vulnerability detection to remediation by clearly surfacing installed vs. missing patches over time.
5. Designing Around Backend Constraints
Accounted for:
API rate limits
Partial data availability
Latency constraints
Focused on clear data states and transparency rather than perfect completeness
System Design
Cross-Platform Consistency
Reused patterns across all modules (filters, tables, KPIs)
Reduced cognitive load across workflows
Component-Driven Architecture
Built using the Adlumin Design System
Ensured scalability across engineering teams
Data Hierarchy & Clarity
Prioritized:
Critical vulnerabilities
Active threats
Actionable insights
Reduced noise in large datasets (10,000+ records)
Impact
Improved Analyst Efficiency
Faster identification of critical vulnerabilities
Reduced time to action across workflows
Better Decision-Making
KPI-driven dashboards improved situational awareness
Trend visualizations enabled proactive security strategies
Scalable Platform
Standardized components and patterns across modules
Supported large datasets and enterprise use cases
Designed for Real-World Constraints
Successfully delivered value despite:
API limitations
Data gaps
Scalability challenges
Key Takeaways
Designing for imperfect systems (API limits, missing data) is as critical as designing ideal experiences
Consistency across complex systems dramatically improves usability
Data visualization is essential for pattern recognition in cybersecurity workflows
Strong design systems enable rapid scaling across multiple product surfaces
Future Opportunities
Real-time vulnerability syncing improvements
Replacement of third-party dependencies (e.g., Qualys)
AI-driven risk prioritization and recommendations
Deeper integration with analyst workflows and automation